Products & Features
Professional-grade tools for market analysis and trading strategy development
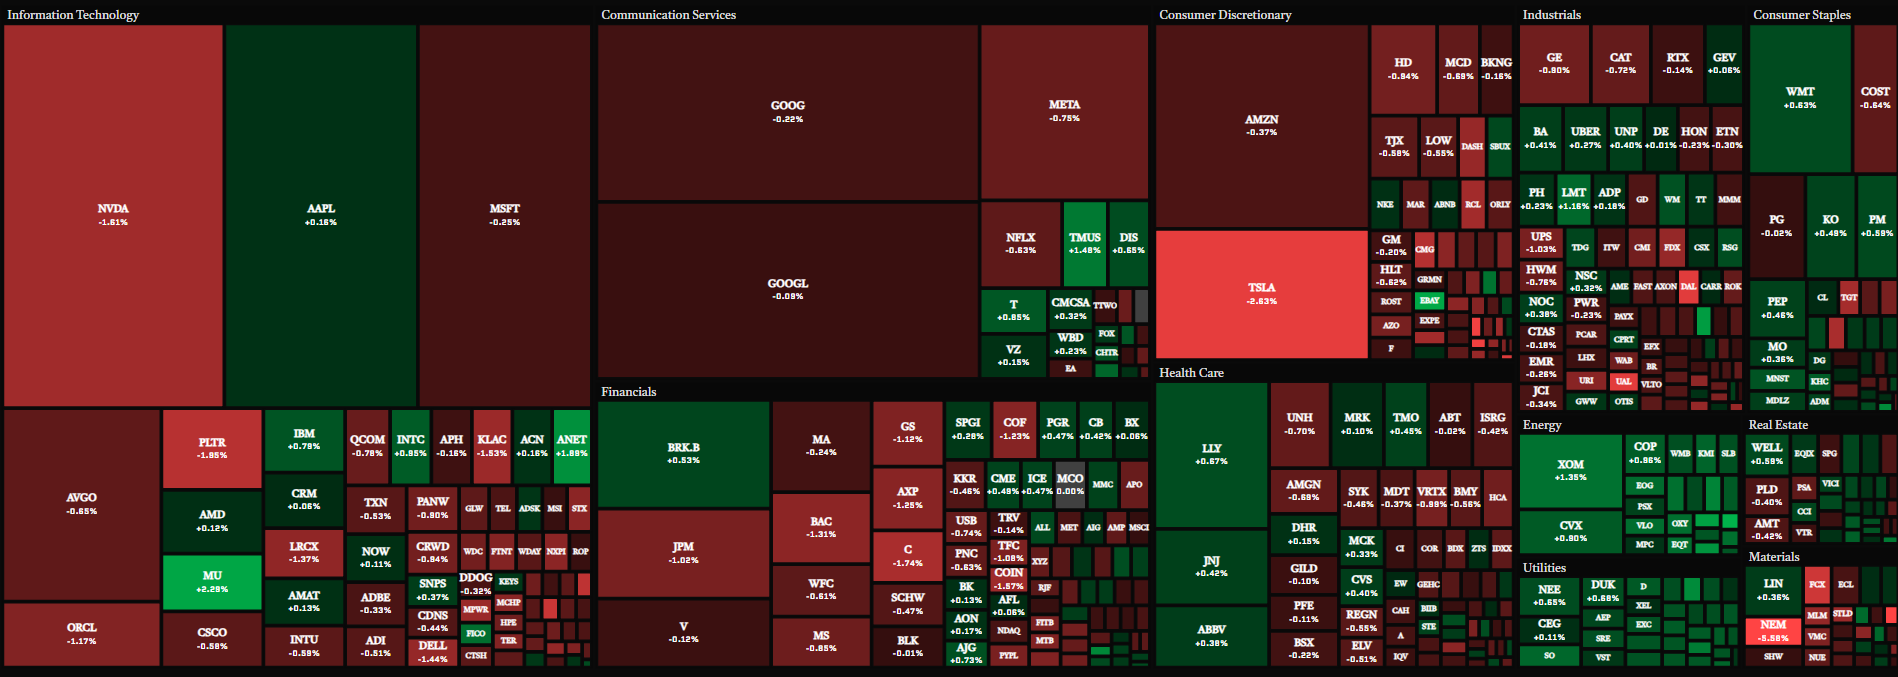
Market Treemap Visualization
Interactive treemap displaying 500+ stocks color-coded by performance. View market structure by sector, identify trends at a glance, and drill down into individual positions.
- Real-time WebSocket updates
- Sector-based organization
- Market cap weighting
- One-click navigation to detailed analysis
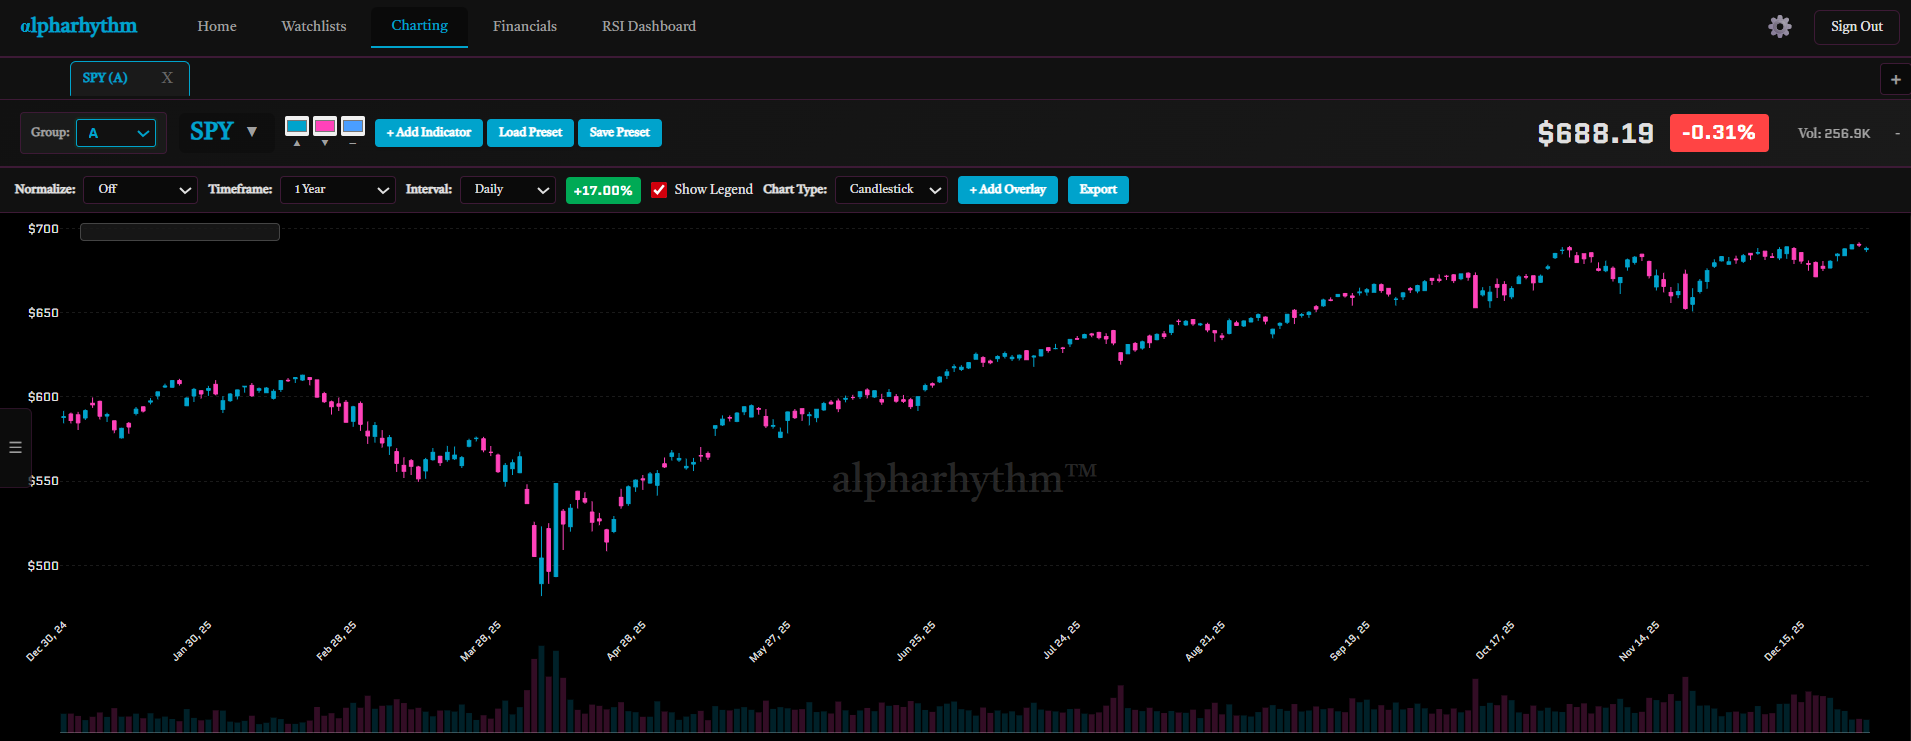
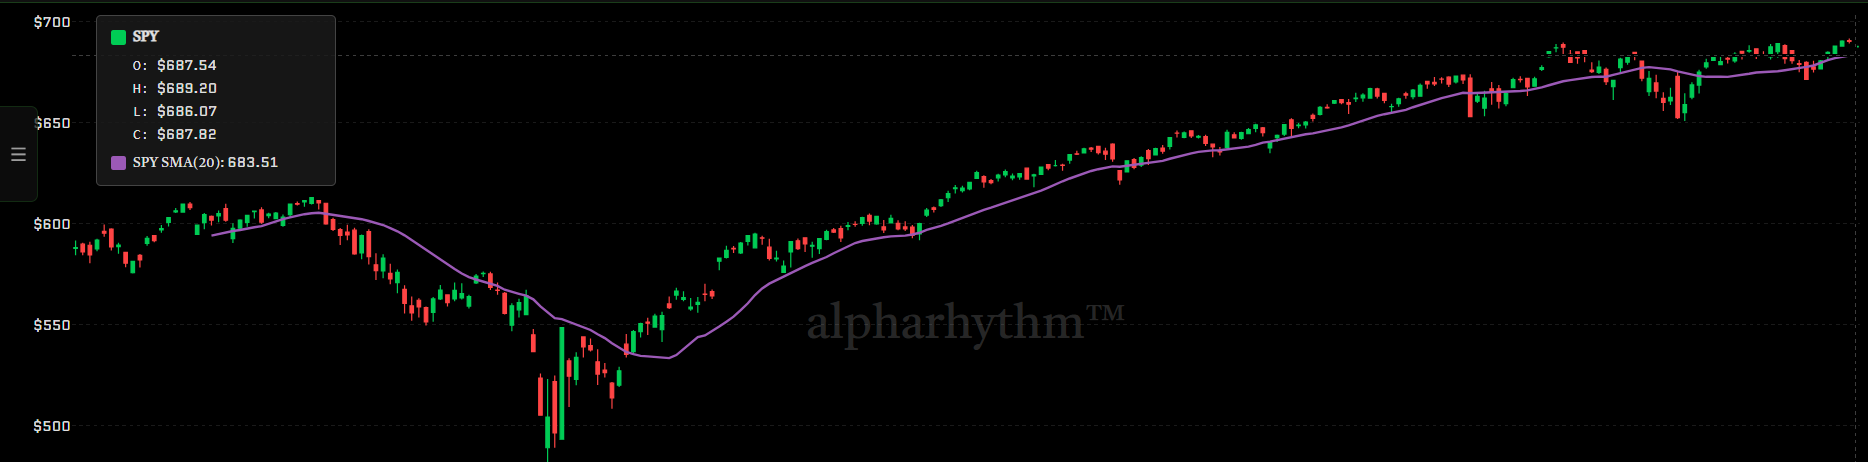
Professional Charting Suite
Multi-timeframe candlestick charts with extensive indicator library, overlay capabilities, and regression analysis tools.
- 20+ technical indicators (RSI, MACD, Bollinger Bands, etc.)
- Multi-ticker overlays with correlation analysis
- Drawing tools (trendlines, support/resistance)
- Extended hours data support
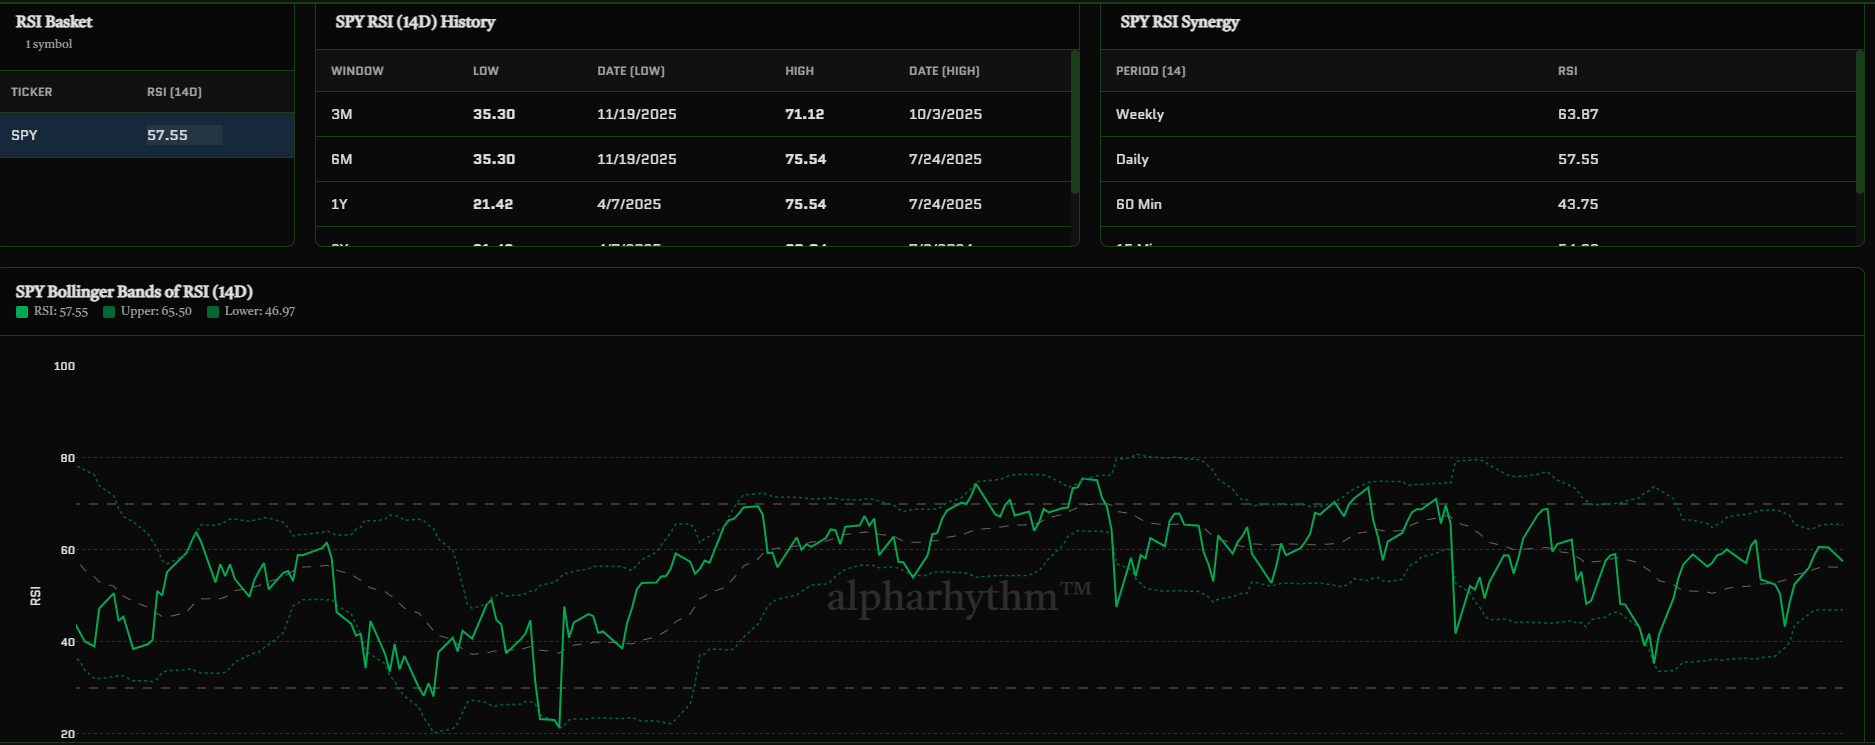
Advanced Momentum Dashboard
RSI-based momentum tracking across your watchlists with historical trend analysis and intelligent filtering.
- Multi-timeframe RSI analysis (14, 30, 60-day periods)
- Historical RSI trend visualization
- Watchlist-wide momentum screening
- Overbought/oversold alerts and filtering
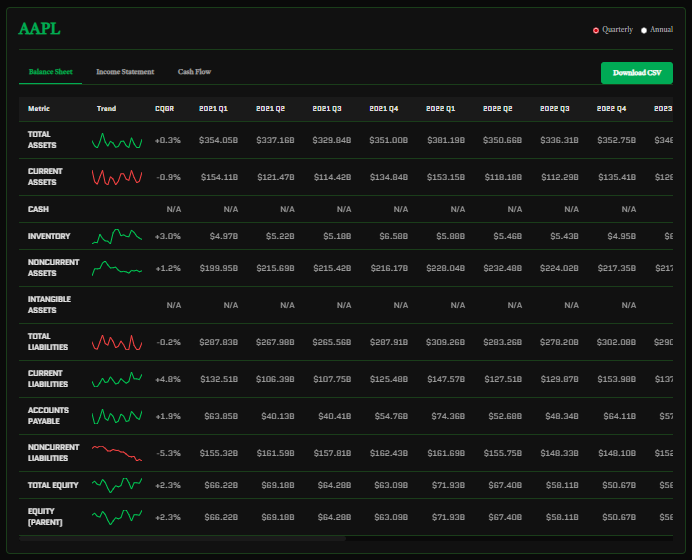
Fundamental Data & Ratios
Deep dive into company financials with quarterly and annual statements, calculated ratios, and trend analysis.
- Balance sheet, income statement, cash flow
- 20+ financial ratios (P/E, ROE, Debt/Equity, etc.)
- Historical trend charts
- Quarter-over-quarter growth metrics
Customizable UI
Personalize your workspace with custom color schemes, saved chart configurations, and flexible layout options.
- Custom color picker for charts and indicators
- Save and load chart presets instantly
- Ticker groups for synchronized navigation
- Settings sync across sessions via Supabase